
Projects Planning
What is "Projects Planning" ?
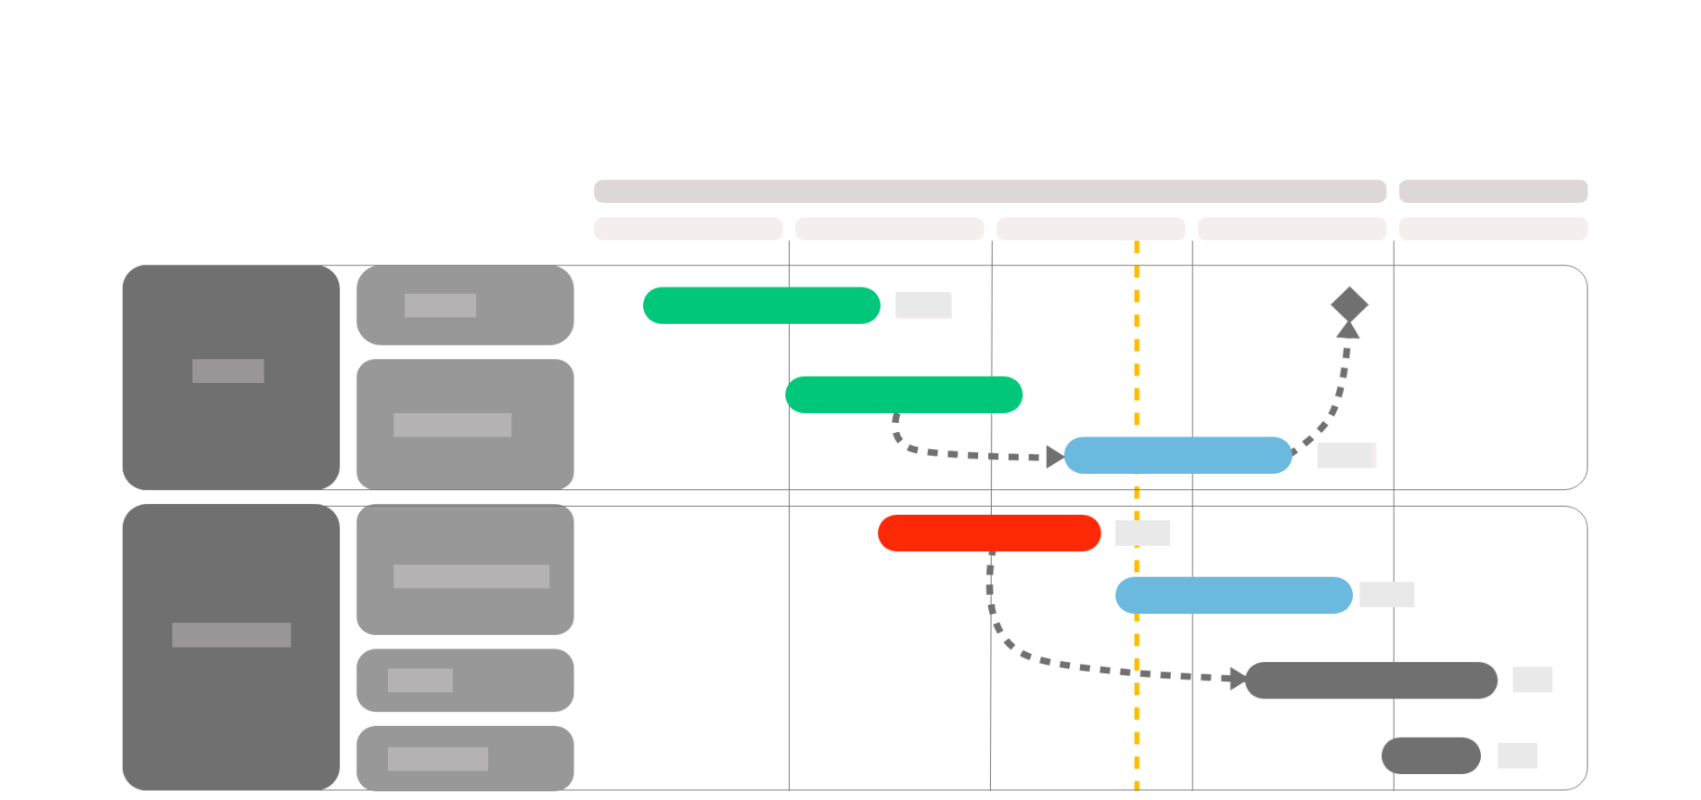
The "Projects Planning" report is represented in a GANTT format, allowing you to display the planning of your projects on the chosen perimeter with the selected grouping axis.
Use case example: This report can be used to monitor the progress of your projects with informations on the time period and a grouping by type and nature of project, to provide additional information.
How is the slide built ?
The slide is built in 4 zones, represented by the orange zones on the image above:


Additional parameters
| Parameter* | Description |
| Display chart legend | Allows you to display the schedule's colored legend |
| Display item period | Allows you to display a bar to show the object's period on the schedule |
| Display today position | Allows you to add a line representing the current date |
| Display dependencies | Allows to display the dependencies between 2 elements on the schedule |
| Display slippages | Allows you to display date offsets between the original end date and the current end date |
| Display holidays | Allows to display holidays, requires a resource field or project manager field to be defined in axis |
| Textbox borders format | Allows you to customize the axis' edges (zone 3) with rounded or unrounded corners |
| Action milestone format | Allows you to choose the milestones' format (circle, diamond or triangle) |
| Milestone label | Allows you to choose the milestone's label to be displayed to add the date or progress for example |
| Milestone color mode | Allows you to choose the milestone's color according to either the status or meteo |
*Click on any parameter to get more informations about its usage
At what level is it available ?
- Project hierarchy : Business Line
- Resource : N/A
- Axis : Business lines grouping, Projects grouping
Tips
- Nothing displaying ? : Check that you have chosen at least one axis, as well a the chosen period. If you do not display "item period", only the elements that are due in the chosen period will be displayed

