
Budget View
What is "Budget View"?
The "Budget View" report is created from a budget view (table or graph). To complete it, you can add a graph consolidating your budget data (consumed, foreseeable and budget envelope). Data in cost or in man days, depending on the chosen parameter.
Use case example : This report can be used to obtain a detailed view of the budget consumption with a graphical representation of the budget detail.
How is the slide built ?
The slide is built by displaying the view you have selected. The slide will reconstruct the view you have created in your dashboard with the blocks' distribution and the saved views of each blocks. Allows you to select the view you wish to build into the slide.
 Display when no view has been selected yet.
 Display when a view has been selected.
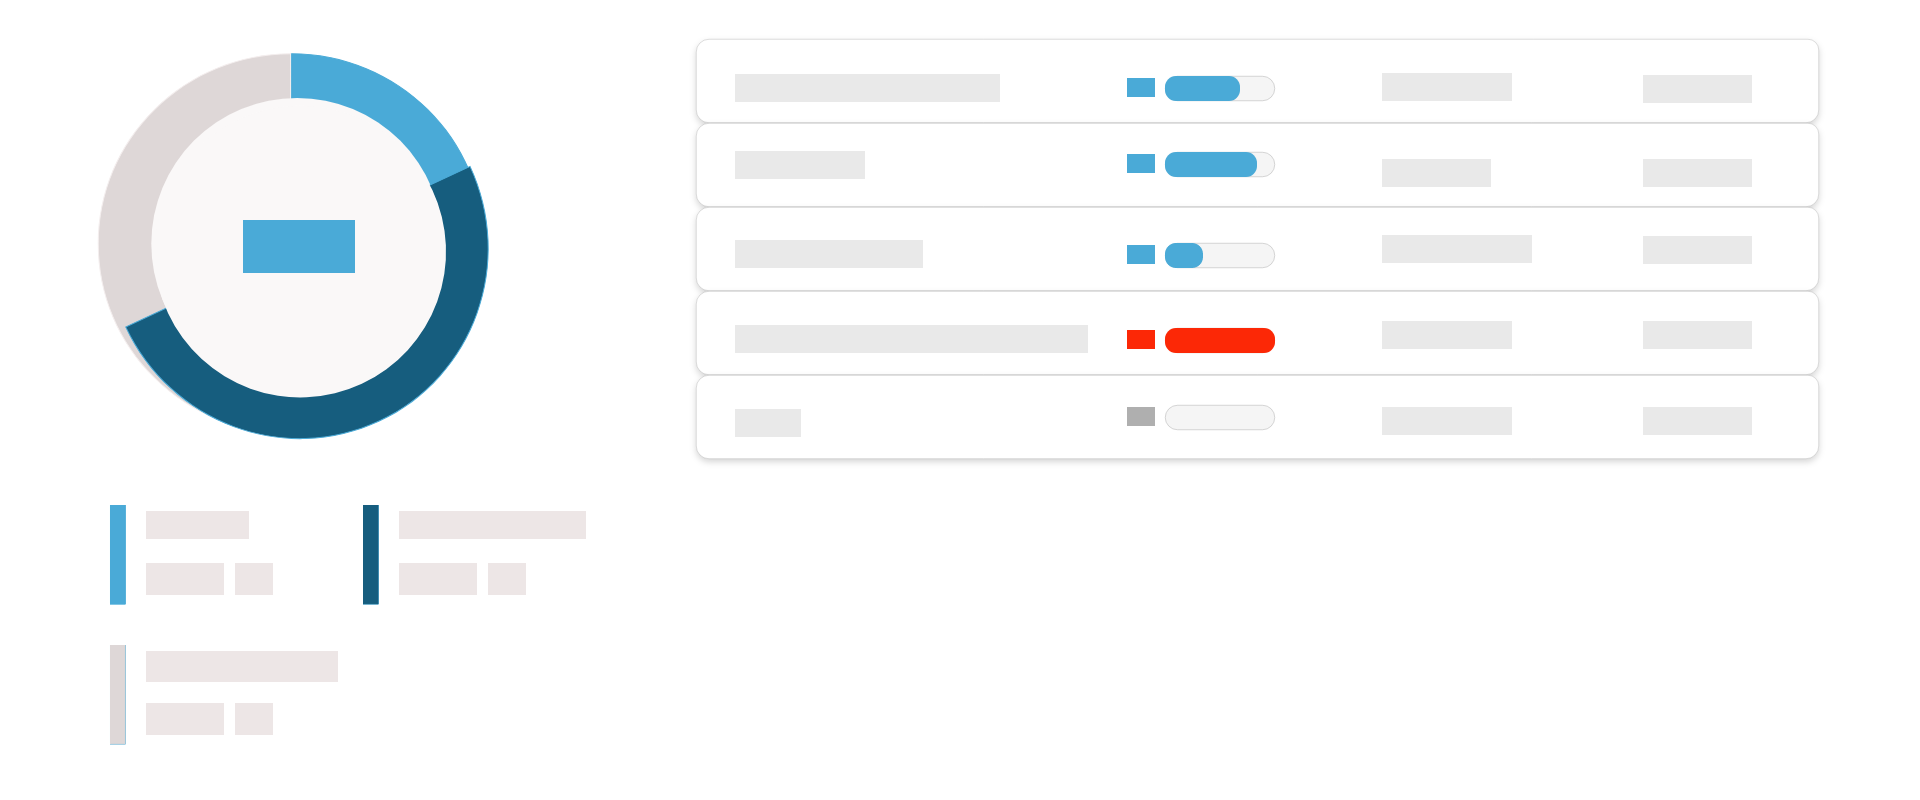
With the help of the additional parameters you can display a donught representing the global budget in a graphic.
Additional parameters
| Parameter* | Description |
| Budget donught (global budget data) | Allows you to add a graph displaying the overall budget |
| Budget type | Allows you to display the budget value in € or days |
*Click on any paramater to get more informations on its usage
Which level is it available at ?
- Project hierarchy : Business Line, Project
- Resource : N/A
- Axis : Business lines grouping, Projects grouping
Tips
- Quick view access : You can quickly access your view using the icon next to the view's name. If you modify your view, the modifications will be automatically taken into account.


