
Workpackages List
What is "Workpackages List" ?
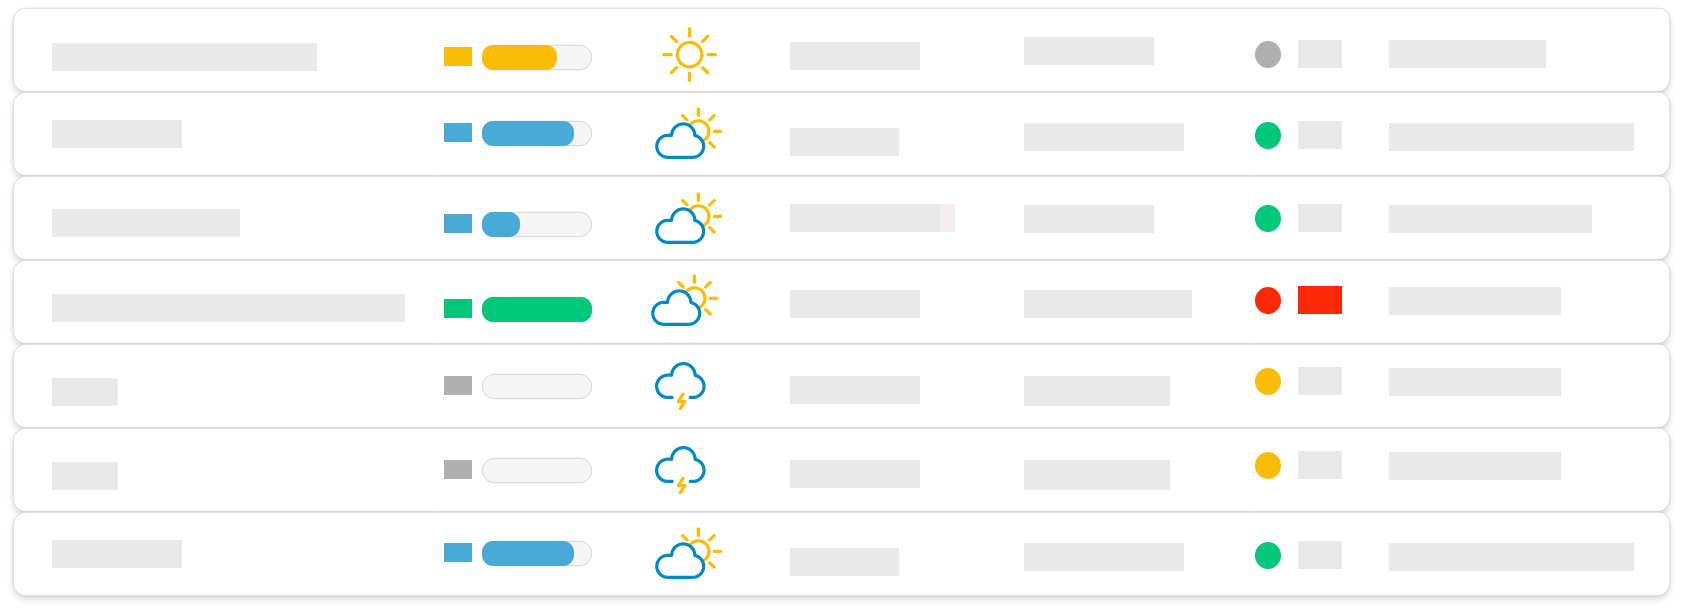
The "Workpackages List" report is represented in a table format, allowing you to display your workpackages' list on the defined perimeter with the list of the selected fields, the filters, the time period and the chosen sorting.
Use case example : This report can be used for a more macro view of a project's progress with meteo informations, progress and an "Overview" text field to comment on each workpackages' progress.
How is the slide built ?
The slide is built in 3 zones, represented by the orange zones in the image above: which will be listed below. The meteo, the progress or the overview of the element concerned by the slide can be displayed.
 the columns' choice to be displayed and the display order,
 the possibility to filter on a time period to take into account the workpackages whose due date is within the month for example,
 the possibility to filter on different fields such as status, or any other available field according to the needs,
 the possibility to sort the table in ascending or descending order on one or more fields.
Additional parameters
| Parameter* | Description |
| Header (Title) | Allows you to add a header line with the indicators or fields of the chosen level (Axis, Business Line, Project, Workpackages). For example, progress, meteo, trend, Overall status… |
| First column formating | Allows you to specify the layout of the 1st column. The color used is based on the template's graphic charter. |
| First row formating | Allows you to specify the layout of the 1st row. The color used is based on the template's graphic charter. |
| Meteo display mod | Allows you to choose how the meteo is displayed, either in meteo mode (sun, cloud...) or in traffic light mode (display of green, orange, red dots...) |
*Click on any parameter to get more informations on its usage.
Which level is it available at ?
- Project hierarchy : Business Line, Project
- Resource : N/A
- Axis : Business lines grouping, Projects grouping, Workpackages grouping
Tips
- Nothing displaying? : Check that the fields to be displayed are defined and that workpackages are due within the defined time period