
Risks matrix
What is "Risks matrix" ?
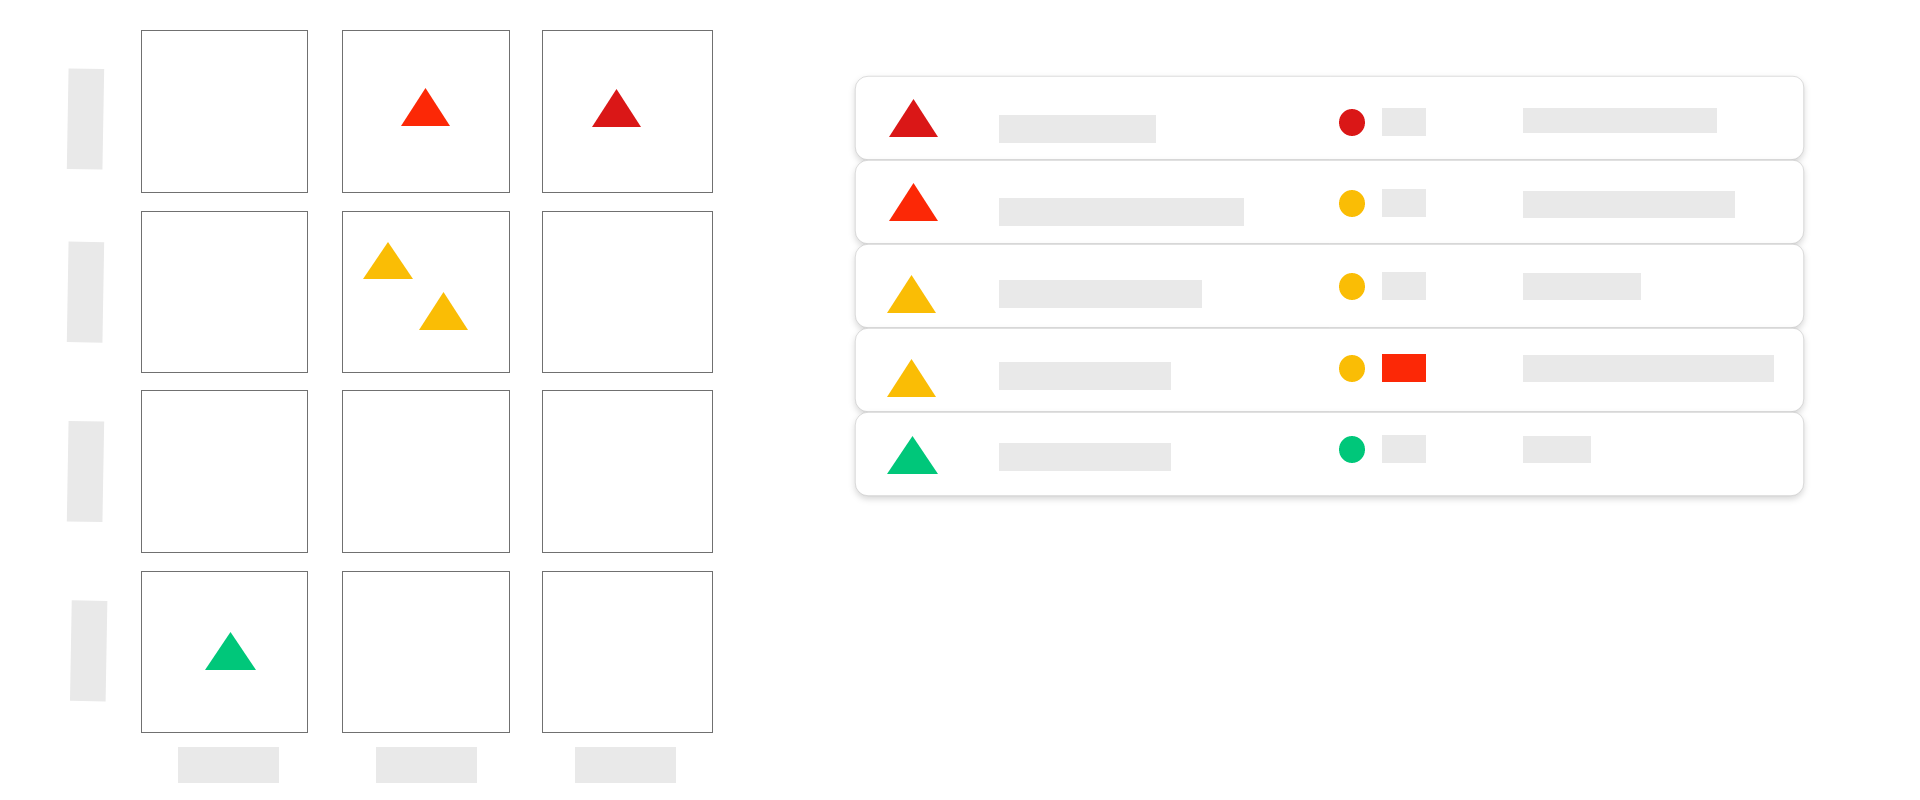
The "Risks matrix" report represents your risks along the probability/impact axis in a matrix and displays the risks' list in a detailed table over the desired columns
User case example : This report can be used to monitor your project 's risks in a visual way
How is th slide built ?
The slide is built in 3 zones, represented by the orange zones in the image above:
which level is it available at ?
- Project hierarchy : Business Line, Project, Workpackage
- Resource : N/A
- Axis : Business lines grouping, Projects grouping, workpackages grouping
Tips
- Nothing displaying ? : Check that the fields to be displayed are defined and that filters do not hide your data
- Need to make a diagonal filter ? : Use the severity field for your filter, it is based on impact + probability