
Project Card
What is "Project Card" ?
The "Project Card" report is displayed in the form of an information sheet on the selected area with a list of the selected blocks.
Use case example : This report can be used during committees to present on one page the essential information of your Project such as a Overall status, previous period, the decisions to be taken, the main deliverables and their meteos and end dates,... Customizable, you can display the fields you want.
How is the slide built ?
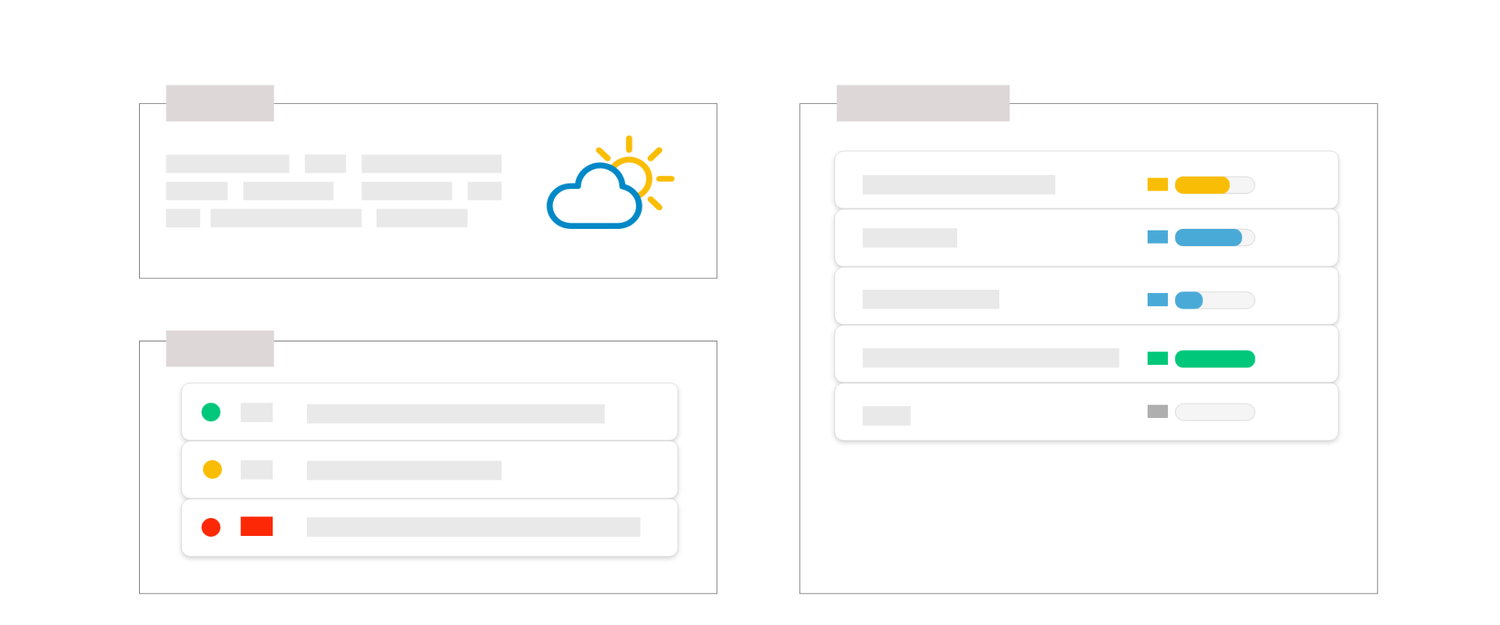
The slide is built in 3 areas, represented by the orange zones in the image above:
When "Delivery" is added in one of the two panes, you can also filter
 , select over a period of time
  , sort
  or choose the fields you want
Additional parameters
| Parameter* | Description |
| Add Business Line to slide name | Allows you to add the Business line's name above the slide title |
| Milestone level | Allows you to define which level is taken into account in the Delivery table. |
| Meteo display mode | Allows you to choose how the meteo is displayed, either in meteo mode (sun, cloud...) or in traffic light mode (display of green, orange, red dots...) |
| Header box mode | Allows you to choose how block headers are displayed, either as an icon, or as a divider (to be added) |
| Right pane | Allows you to define which blocks to display on the right side of the slide. For example "Delivery" allows you to display a table of your deliverables (depending on the chosen level) |
| Left pane | Allows you to define which blocks to display on the left side of the slide. For example Overall status allows you to display the meteo in addition to a global comment, you can also put a description, decisions, or any other available blocks. |
*Click on any setting to get more informations on its usage.
At what level is it available?
- Project hierarchy : Project
- Resource : N/A
- Axis : Projects grouping
Tips
- Too many deliverables ? : If you have a lot of deliverables to display, put only one block on one of the 2 panes and consider using the filters
