
Planning summary
What is "Planning summary" ?
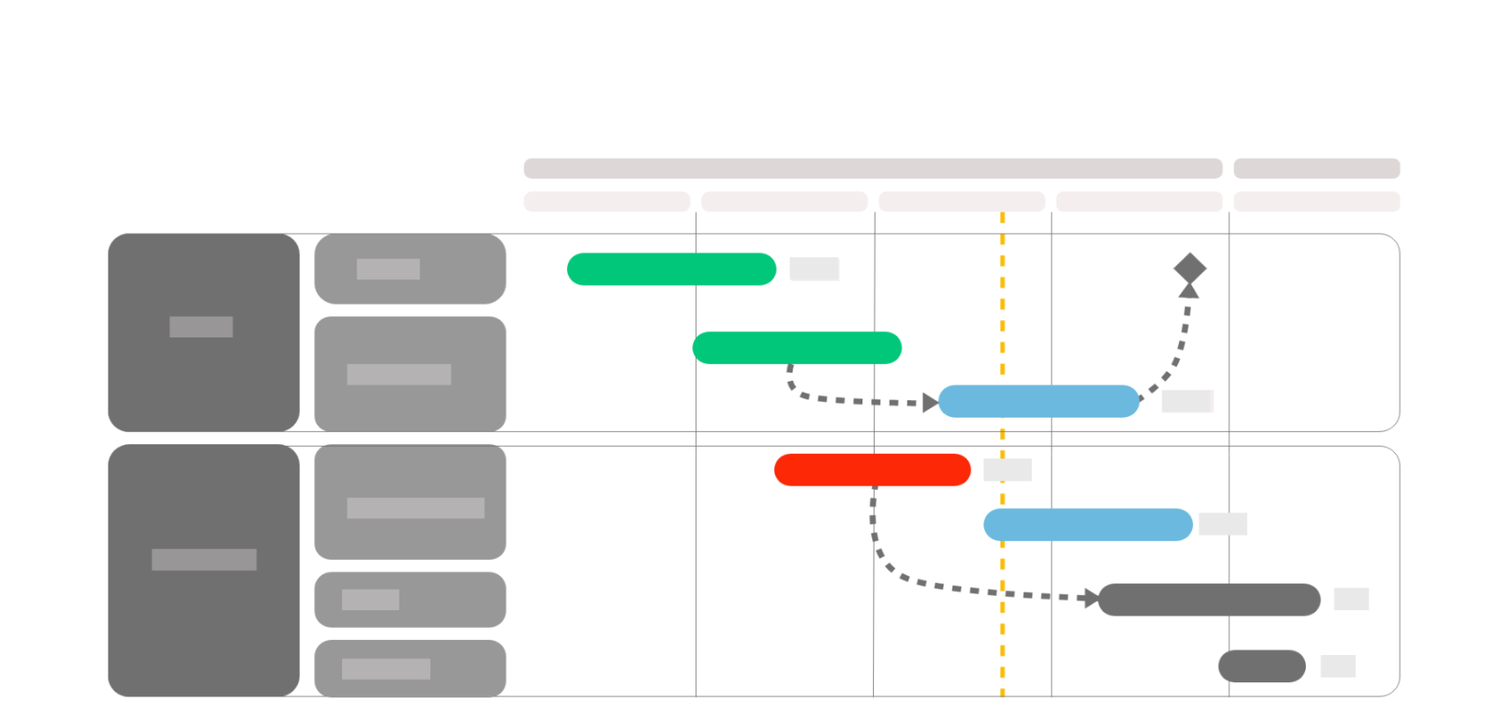
The "Planning summary" report is represented in a gantt format, allowing you to display the elements of 2 levels (projects & workpackages when at business line level, workpackages & actions when at project level,...). You can narrow down the selection using filters, the time period of your choice and sorts.
Use case example : This report can be used to monitor the progress of your projects over time in a schedule's form.
How is the slide built ?
The slide is built in 3 zones, represented by the orange zones in the image above:

Additional parameters
| Parameter* | Description | |
| Display today position | Allows you to add a line representing the current date | |
| Workpackage milestone format | Allows you to choose the milestone's format (circle, diamond or triangle) | |
| Letter in milestone | If the child milestone is displayed, allows you to choose the axis whose first letter will be used within the milestone (ex: None, Task_Type, Category) | |
| Milestone color mode | Allows you to choose the milestone's color according to either the status or meteo |
*Click on any parameter to get more informations about its usage
Which level is it available at ?
- Project hierarchy : Business Line, Project, Workpackage
- Resource : N/A
- Axis : Business lines grouping, Projects grouping, Workpackages grouping
Tips
- Nothing displaying ? : Check that you have chosen a period containing data.